


FarmEnergy project

Abstract:
The aim of this article is to present the project and an example of an energy community in Finland. This article also presents some of the measures introduced by the European Parliament to encourage the development of energy communities. Finally, it also explains a simple way of using electricity prices to reduce electricity bills.
To combat the global warming, every nation has a growing need for energy. In spite of increasingly overburdened suppliers, governments must constantly increase energy production as cleanly as possible. In addition, European citizens have a growing desire for self-sufficiency and autonomy. As electricity is difficult to transport and also subject to intermittency, a fast and efficient solution is needed. In this way, an opportunity seems to emerge that could increase self-sufficiency and reduce the burden on suppliers.
Energy communities are local groups of citizens who want to invest in clean energy. Energy communities offer many benefits such as empowering citizens, installing renewable energy, increasing public acceptance of renewable energies and creating jobs in the clean energy sector. Most of the time, it is combined with the improvement of energy efficiency.
The energy community we are studying is called the “FarmEnergy project”. Its final goal is the self-sufficiency of several farms in Finland fed by photovoltaic panels. The project can be divided into four main parts:
- 1. Creation of the virtual energy community and the trading platform
- 2. Development of competitive prices
- 3. Simulation of the energy community
- 4. Communication and Project Management
(Xamk n.d.)
However, one problem remains and stops the installation of the project: the regulations are not ready yet and so we can only have a virtual simulation of the project. Indeed, as the energy communities are a very recent initiative, the European Parliament had to create a lot of new regulations to adapt the European market to this new type of energy production.
The Directive 2019/944 of the European Parliament and of the Council of 5 June 2019 on common rule for the internal market for electricity and amending Directives 2012/27/EU establishes the articles that have been introduced to facilitate the creation and the development of energy communities. For example, the Article 4 of this Directive starts “The Commission Communication of 25 February 2015 […] sets out a vision of an Energy Union with citizens at its core, where citizens take ownership of the energy transition, benefits from new technologies to reduce their bills”. We can observe that one of the main objectives is to empower citizens to become an actor in the energy transition through innovation, so that they can ultimately reap the benefits and reduce their annual energy bills.
These regulations contain directives that sometimes focus on the customer as mentioned above sometimes in a more general way on the internal electricity market itself. The Article 18 of the Directive starts “Electricity markets differ from other markets such as those for natural gas, for example, because they involve the trading in a commodity which cannot currently be easily stored [..]. The electricity markets require a high degree of cooperation among system operators […] and regulatory authorities, in particular where electricity is traded via market coupling.” This Article focuses on the cross-border cooperation due to difficulties in transporting and storing electricity.
In both cases, the aim is to facilitate the development of energy communities by empowering citizens.
Dairy Farm data:
The first step of the project is to calculate the energy consumption of the farm. The farm has several
mains devices in energy consumption represented on this farm picture:
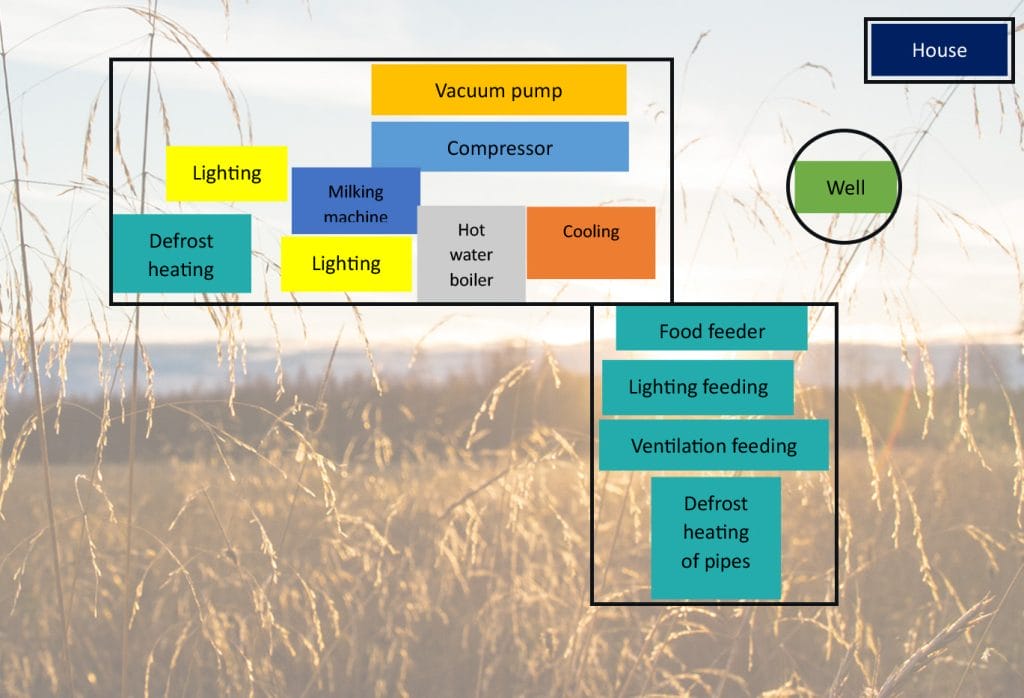
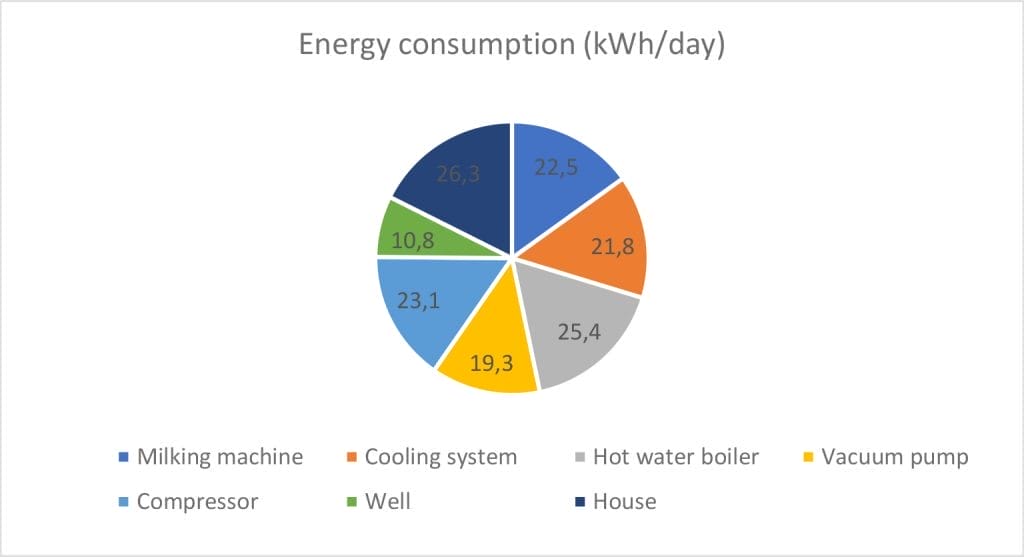
To do this, the students measured hourly active power of the main appliances on the farm such as the hot water boiler or the vacuum pump approximately for one week. They had measured the active power for each device for each hour on each day of a week. After calculating the average power per device for a whole week, they had this diagram showing the distribution of the consumption of the devices in a week:
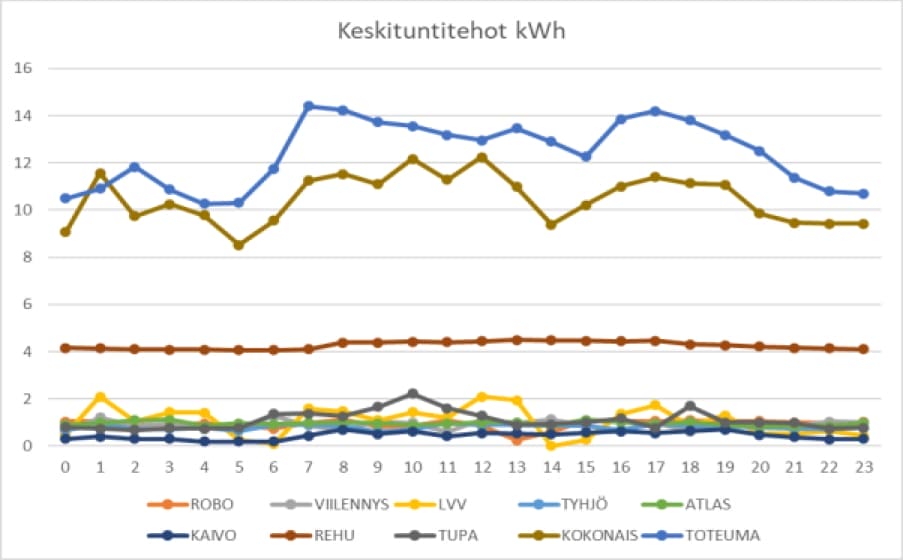
Based on a simulation, they calculated the energy which need to be produced by PV systems. At the end, to assess the accuracy of the measurements, the students have compared their data with that of the supplier, which they considered to be the correct value.
The brown curve on the graph (figure 3) is the energy consumption measured by the students and the blue curve is the energy consumption measured by the supplier. The students’ curve follows the supplier’s trend so the results can be considered correct. The student’s measurements only took into account only the main appliances, that’s why their curve is lower than the supplier’s.
Poultry Farm data:
Afterwards, the next question is how to reduce this consumption. Teemu Manninen has measured the power consumed by different parts of the Poultry Farm as the Northern barn or the solar energy that feds the farm:
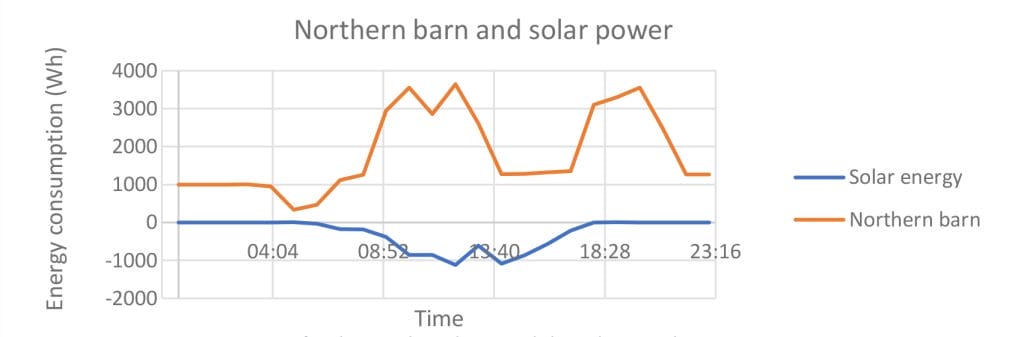
In this way, the study of the energy exchange rate could be interesting.
Now, to reduce energy bills, we are going to study the electricity prices during the day. The website Nord Pool Day-ahead prices provides the electricity prices during a hole day. As an example, for the day of 16/04/2024 here is the electricity prices:
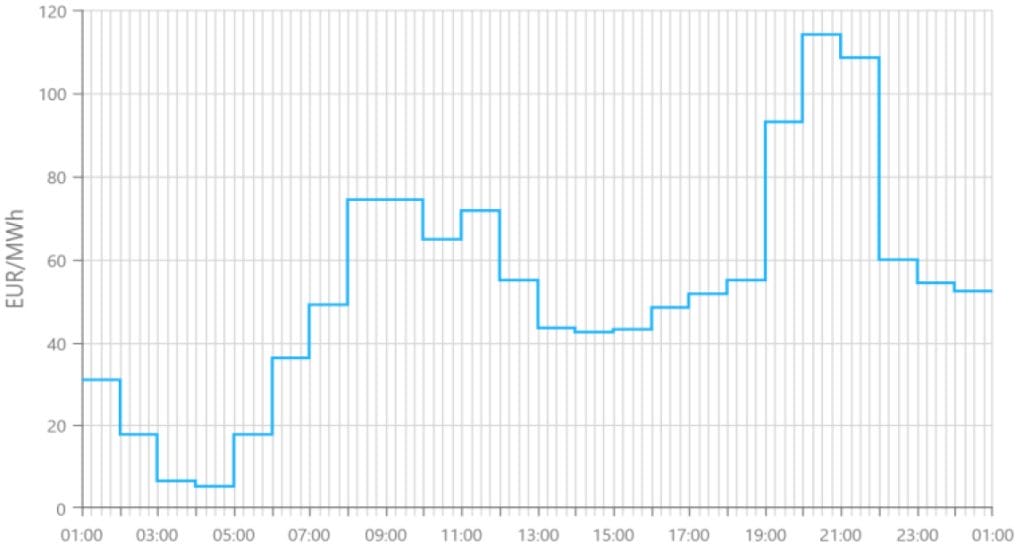
From these two graphs, we can notice that the peak of energy consumption of the farm occurs when the prices are the highest in the evening. In fact, the demand is high in the evening because of the lighting of the houses. The prices will rise vice-versa.
So, to reduce the energy bills when using marked-based-pricing tariff, the obvious solution would be to use the energy as much as possible at times when the price of electricity is lowest, for example in the middle of the afternoon or in the middle of the night. This makes sense. Indeed, in the middle of the night, people are asleep and so the demand is low which leads to the low prices. For the afternoon, the prices lower than usually, it depends on many different factors.
To reduce the energy consumption the solution would be to consume the energy as much as possible when the prices are low as at 4 a.m. For example, we could program the washing machine to start at 4am to consume when prices are low if the timer function is available.
This report covers many topics. We have started with a presentation of European regulations established to facilitate the development of the energy communities’ development. We talked about the Article 4, which focuses on the empowerment of the citizens, and the Article 18 on international cooperation. We then studied the distribution of energy consumption distribution for the main households’ appliances. We concluded that the results were correct and that the sector with the highest energy consumption was the boiler. Finally, the idea was to study the best way to reduce the electricity bills taking into account the electricity prices during the day. We concluded that a good way to minimise costs would be to use the electricity as much as possible when the demand is low for example at the middle of the night or in the afternoon. The aim of this method is to avoid the early evening when prices are very high.
This study gave me a simple way to reduce the energy bills using some economic concepts such as market prices, demand and supply. I also learnt a solution that could contribute to the fight against the climate change, which is the energy communities and their benefits at local or international scale for our current societies with growing energy needs.
References
DIRECTIVE (EU) 2019/944 OF THE EUROPEAN PARLIAMENT AND OF THE COUNCIL of 5 June 2019 on common rules for the internal market fir electricity and amending Directive 2012/27/EU
XAMK-South-Eastern Finland University of Applied Sciences available on https://www.xamk.fi/tutkimus-ja-kehitys/farmenergy-maatilojen-energiayhteiso/ [Accessed 6 May 2024]
T., Manninen. data on the Poultry Farm
K., Pesonen. data on the Dairy Farm

FarmEnergy – Rural energy community
Tutustu myös näihin artikkeleihin
INGENIUM’s Senior School helps participants build European networks, develop working-life skills, and identify their personal strengths

Now is a great time to apply for summer jobs!